







Business intelligence consulting helps organizations turn scattered data into reliable insights for faster, more accurate decisions. Consultants improve data quality, connect systems, select suitable analytics tools, and create dashboards that support reporting, forecasting, performance tracking, and long-term growth.
Define Business Goals and Decision-Making Priorities
Begin a business intelligence consulting engagement by identifying the business decisions that require better information. Leadership teams may need clearer revenue forecasts, finance departments may need automated profitability reports, and sales managers may need visibility into pipeline performance. Defining these priorities gives the consulting team a measurable target and prevents the project from becoming a technology exercise without a business outcome.
Each department should document the decisions it makes regularly, the reports it currently uses, and the information gaps that create delays or uncertainty. Consultants can then connect these needs to specific measurements, data sources, reporting frequencies, and dashboard audiences. For example, a retail company may need daily inventory visibility, weekly sales performance reports, and monthly margin analysis. A healthcare organization may require patient volume trends, resource utilization reports, and service-level monitoring.
Business priorities also determine the order of implementation. High-value use cases that rely on accessible data can be delivered first, while complex forecasting or enterprise-wide reporting can follow after the foundation is stable. This phased approach produces early results, improves stakeholder confidence, and allows the organization to refine its analytics strategy based on actual usage.
Assess Existing Data Sources and Reporting Systems
Evaluate every major data source before selecting a business intelligence platform or building dashboards. Most organizations store information across customer relationship management systems, enterprise resource planning software, accounting applications, spreadsheets, cloud databases, marketing platforms, and operational tools. A business intelligence consultant maps these systems and identifies how data moves between them.
The assessment should review data availability, ownership, accuracy, duplication, update frequency, security restrictions, and integration options. Consultants also examine existing reports to determine which calculations are trusted, which reports are duplicated, and which processes depend heavily on manual spreadsheet work. This review often reveals conflicting definitions for revenue, customer activity, inventory status, or employee productivity.
A complete assessment reduces implementation risk. It shows whether the organization needs a data warehouse, a lakehouse, direct system connections, or a combination of these approaches. It also helps estimate the effort required for integration, cleansing, modeling, and migration. The final assessment should provide a clear picture of the current environment and a practical route toward a more reliable reporting structure.
Finding Hidden Reporting Risk in Spreadsheet-Based Operations
Imagine a wholesale distributor that prepares its weekly sales report by exporting orders from its ERP system, customer information from its CRM, and commission figures from separate spreadsheets maintained by regional managers. The final report appears reliable, but the assessment reveals that customer names are formatted differently across systems and several account managers manually adjust figures before submission.
A BI consultant can document each transformation between the original transaction and the final management report. This process may reveal that the same customer appears under multiple names, cancelled orders remain in exported files, and commission calculations use outdated territory assignments. These issues are difficult to identify by examining the final dashboard alone.
A source-to-report review therefore helps consultants identify risks before automation reproduces them at scale. Automating an unreliable process only delivers unreliable information faster. Mapping calculations, manual adjustments, file transfers, and ownership points provides a stronger foundation for subsequent integration and reporting work.
Establish a Practical Business Intelligence Strategy

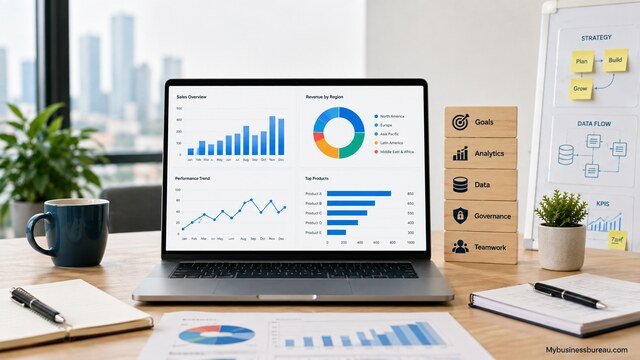
Create a business intelligence strategy that connects technology investments with operational and financial goals. The strategy should explain which business areas will be supported, which analytics capabilities will be developed, and how success will be measured. It should also define the responsibilities of executives, department leaders, technical teams, analysts, and external consultants.
A strong strategy includes priorities for reporting, self-service analytics, data integration, data quality, security, governance, and user adoption. It should specify whether the organization will centralize analytics within one team or distribute reporting responsibilities across departments. Many companies use a hybrid model in which a central team manages shared data models and standards while trained business users create approved reports.
The strategy must remain realistic. A small company may benefit from a focused cloud reporting solution connected to accounting and sales systems, while a multinational organization may need an enterprise data platform with advanced access controls and regional reporting layers. The best strategy matches the company’s size, technical maturity, budget, regulatory responsibilities, and expected growth.
Select the Right Business Intelligence Platform
Choose a business intelligence platform based on business requirements rather than brand recognition alone. Microsoft Power BI, Tableau, Qlik Sense, Looker, and other analytics tools offer different strengths in visualization, data modeling, cloud integration, embedded analytics, collaboration, and licensing. Business intelligence consulting helps organizations compare these capabilities objectively.
The evaluation should consider data source compatibility, dashboard performance, mobile access, security, user permissions, deployment options, learning requirements, administration effort, and total ownership cost. A company that already uses Microsoft 365 and Azure may gain operational benefits from Power BI. An organization with complex visual analysis needs may prefer Tableau. A cloud-native company using Google Cloud may consider Looker for governed data exploration.
Platform selection should also account for future usage. A tool that works for ten analysts may become difficult to govern when hundreds of employees create reports. Consultants therefore assess scalability, workspace management, version control, reusable data models, audit logs, and support for embedded analytics. A structured selection process reduces the risk of purchasing an expensive platform that does not fit the organization’s working methods.
| Evaluation Area | Questions to Review | Business Impact |
| Data connectivity | Can the platform connect to current databases, cloud applications, and files? | Reduces custom integration work |
| Scalability | Can it support more users, reports, and data volumes? | Protects future investment |
| Security | Does it support role-based access and row-level restrictions? | Protects sensitive information |
| Usability | Can business users create and understand reports? | Improves adoption |
| Performance | Can dashboards load quickly with large datasets? | Supports timely decision-making |
| Licensing | Are costs predictable as usage increases? | Controls long-term spending |
| Administration | Can internal teams manage workspaces and permissions? | Reduces dependency on consultants |
Test Platforms With a Real Business Use Case Before Committing
A feature checklist cannot always reveal how a BI platform will perform inside a specific organization. Consultants can reduce selection risk by building a small proof of concept using actual business data, actual security requirements, and a representative dashboard. The test should reproduce a meaningful workflow rather than simply demonstrate attractive visualizations.
For example, a logistics company evaluating two analytics platforms could load several months of shipment records, customer information, delivery events, and regional targets. The evaluation team could then measure dashboard loading speed, data refresh duration, permission management, mobile usability, drill-down behavior, and the effort required to create calculated measures. A platform that looks strong during a sales demonstration may require significantly more administration when tested against real operational data.
Design a Scalable Data Architecture
Build a data architecture that delivers consistent, accurate, and timely information to reporting tools. Business intelligence dashboards depend on the quality of the underlying architecture, including source systems, integration pipelines, storage layers, transformation processes, and analytical models. Without a stable foundation, even visually impressive dashboards may show incorrect or outdated results.
Consultants may recommend a cloud data warehouse, an on-premises warehouse, a lakehouse, or a blended environment. Platforms such as Microsoft Fabric, Azure Synapse Analytics, Snowflake, Google BigQuery, Amazon Redshift, and Databricks can support different workloads. The final choice depends on data volume, query complexity, infrastructure preferences, security needs, and existing cloud investments.
The architecture should separate raw source data from cleaned and business-ready information. This structure allows technical teams to preserve source records while creating reliable reporting tables for analysts. It also improves troubleshooting because each stage of the data flow can be reviewed independently. A scalable architecture reduces reporting delays, supports additional data sources, and enables advanced analytics when the organization is ready.
Integrate Business Applications and Data Sources
Connect the systems that contain operational, customer, financial, and marketing information. Business intelligence consulting often includes integration work across CRM platforms, ERP systems, accounting software, e-commerce platforms, web analytics tools, human resources systems, and industry-specific applications. These connections create a unified view of organizational performance.
Integration methods may include application programming interfaces, database replication, cloud connectors, scheduled file transfers, streaming services, and extract-transform-load pipelines. Consultants select methods based on the source system, update frequency, data volume, and reliability requirements. A sales dashboard may need hourly CRM updates, while a board-level financial report may only require daily or monthly refreshes.
Successful integration also requires monitoring. Pipelines should record refresh times, data volumes, failures, and unusual changes. Alerts should notify responsible teams when a source system becomes unavailable or a data load produces unexpected results. This operational discipline keeps dashboards dependable and prevents users from making decisions based on incomplete information.
Connect Marketing Spend to Actual Customer Revenue
A growing service company may know how many leads each advertising channel generates without knowing which channels produce profitable customers. Marketing data might sit in advertising platforms, lead details in the CRM, invoices in accounting software, and contract renewals in a separate customer management system.
A BI consulting project can connect these records through campaign identifiers, customer IDs, lead records, and transaction data. Instead of reporting only clicks or leads, the company can compare advertising spend with qualified opportunities, closed revenue, average customer value, and renewal behavior. Management may discover that one channel generates fewer leads but produces customers with substantially higher lifetime value.
Improve Data Quality and Standardize Business Definitions
Create repeatable processes for identifying and correcting data quality problems. Duplicate customer records, missing product codes, inconsistent date formats, incomplete transactions, and incorrect classifications can weaken every report built on top of the data. Business intelligence consultants analyze these issues and design validation rules to improve reliability.
Standardized business definitions are equally important. Different departments may calculate revenue, churn, gross margin, active customers, or conversion rates in different ways. A consulting engagement should document each important calculation, identify its source fields, and establish one approved formula. Shared definitions allow teams to compare results without debating which report is correct.
Data quality improvement is an ongoing responsibility rather than a one-time cleanup. Automated checks can monitor missing values, duplicate records, unexpected totals, delayed refreshes, and unusual data changes. Clear ownership should be assigned to the departments that create or maintain the original information. This combination of technical controls and operational responsibility produces more trustworthy analytics.
Build Reliable Data Models and Performance Metrics
Develop data models that organize information around measurable business processes. A well-designed model allows reports to calculate results quickly and consistently across departments. It connects facts such as sales transactions, service requests, inventory movements, or financial postings with descriptive information such as customers, products, locations, employees, and dates.
Consultants often use dimensional modeling, semantic layers, reusable measures, and governed datasets to simplify reporting. These structures reduce the need for each analyst to rebuild calculations independently. For example, one approved revenue measure can be used across executive dashboards, regional reports, sales analysis, and financial planning.
Performance metrics should be connected to specific goals and decisions. Revenue growth, customer acquisition cost, inventory turnover, operating margin, forecast accuracy, employee utilization, and service resolution time can all support management decisions when they are calculated consistently. Each metric should have a documented owner, formula, update frequency, target, and interpretation.
| Business Area | Common Performance Measures | Typical Data Sources |
| Sales | Revenue, win rate, pipeline value, average deal size | CRM, billing system |
| Marketing | Lead cost, conversion rate, campaign return | Advertising platforms, CRM, web analytics |
| Finance | Gross margin, cash flow, budget variance, operating expense | ERP, accounting software |
| Operations | Cycle time, output volume, defect rate, capacity use | Production and workflow systems |
| Customer service | Resolution time, satisfaction score, backlog, first-contact resolution | Support platform, survey tools |
| Supply chain | Inventory turnover, order accuracy, delivery time, stockouts | ERP, warehouse system |
| Human resources | Turnover, absenteeism, hiring time, labor cost | HRIS, payroll system |
Create Role-Specific Dashboards and Reports
Design dashboards around the responsibilities of each user group. Executives need a concise view of company performance, department managers need operational detail, and analysts need flexible tools for deeper exploration. A single dashboard rarely serves all three audiences effectively.
Executive dashboards should emphasize strategic measures, trends, targets, risks, and exceptions. Operational dashboards should show current workloads, bottlenecks, service levels, and activities that require immediate attention. Analytical reports should allow users to filter, compare, drill down, and examine supporting details. Consultants organize these views to prevent overcrowding and reduce unnecessary visual elements.
Good dashboard design also guides attention. Clear titles, consistent colors, readable labels, meaningful comparisons, and visible refresh dates help users interpret information quickly. Charts should be selected according to the question being answered. Trend lines show change over time, bar charts compare categories, maps display geographic patterns, and scorecards show progress against targets.
Implement Data Governance and Security Controls

Protect business information through defined access rules, ownership responsibilities, and approval processes. Business intelligence systems often contain financial records, customer details, employee information, operational results, and confidential forecasts. Governance ensures that users can access the information they need without exposing sensitive data unnecessarily.
Security controls may include role-based permissions, row-level security, column restrictions, workspace separation, identity management, encryption, and audit logging. For example, a regional manager may view only data for assigned territories, while the finance team may access detailed cost information unavailable to general sales users. Consultants configure these controls within the analytics platform and supporting data systems.
Governance should also cover report creation and publishing. Organizations need rules for certified datasets, approved metrics, naming standards, retention periods, development environments, and report ownership. These controls reduce duplication and prevent unverified reports from being treated as official records. Effective governance supports both control and productivity by giving users trusted resources for self-service analysis.
Automate Reporting and Reduce Manual Work
Replace repetitive spreadsheet preparation with scheduled data refreshes and automated report distribution. Many organizations spend hours each week exporting data, copying values, updating formulas, and assembling presentation files. Business intelligence consulting identifies these tasks and redesigns them as controlled, repeatable workflows.
Automation may include scheduled pipeline runs, dashboard refreshes, email subscriptions, threshold alerts, and report exports. A finance team can receive a daily cash position report, a sales manager can be alerted when pipeline coverage falls below target, and an operations leader can monitor service delays through a live dashboard. These processes improve speed while reducing the risk of manual error.
Automation also changes how employees use their time. Analysts can focus on interpretation, forecasting, and problem-solving instead of report preparation. Managers receive information earlier and can respond before performance issues become more serious. The organization gains a more consistent reporting cycle with less dependence on individual employees.
Enable Self-Service Analytics Without Losing Control
Give trained business users the ability to explore data and create reports within a governed environment. Self-service analytics can reduce report backlogs and help departments answer routine questions without waiting for technical teams. However, unrestricted access can lead to duplicated datasets, conflicting calculations, and uncontrolled sharing.
Consultants create a balanced structure by providing certified datasets, reusable measures, templates, documentation, and defined workspaces. Users can build reports from approved information while central teams manage security, data preparation, and important calculations. This approach supports flexibility without weakening reliability.
Training is essential for successful self-service analytics. Users need to understand how to select measures, apply filters, interpret visualizations, and validate results. They should also know when a question requires help from a data engineer, analyst, or subject specialist. Clear guidance allows employees to become more independent while maintaining confidence in the results.
Develop Forecasting and Advanced Analytics Capabilities
Expand the business intelligence environment from historical reporting to predictive decision support. Once data is clean, integrated, and consistently modeled, organizations can use forecasting, statistical analysis, machine learning, and scenario planning to estimate future outcomes.
Sales teams may forecast revenue by product, territory, or account. Finance teams may model cash flow and budget scenarios. Supply chain leaders may predict demand, stock requirements, and delivery risks. Customer teams may identify accounts with a higher likelihood of churn. Consultants help select appropriate methods and ensure the output can be understood by business users.
Advanced analytics should support a practical decision rather than exist as an isolated technical experiment. A prediction becomes valuable when it is delivered to the person who can act on it, at the right time, and in a usable format. Consultants therefore integrate predictive results into dashboards, alerts, workflow systems, or planning processes.
Combine Forecasts With Decision Scenarios
Forecasting becomes more useful when managers can examine how different assumptions change the expected result. Instead of displaying one projected revenue number, a BI solution can present baseline, optimistic, and downside scenarios based on variables that management can influence or monitor.
A manufacturer, for example, could model expected production requirements using order history, seasonal demand, current pipeline activity, supplier lead times, and inventory levels. Managers could then test how a 10 percent increase in demand, a supplier delay, or a reduction in available capacity would affect stock requirements and delivery commitments.
Train Users and Improve Analytics Adoption
Prepare employees to use new dashboards, reports, and analytical tools effectively. A technically successful system can still fail when users do not understand it, trust it, or include it in their daily work. Business intelligence consulting should therefore include role-specific training and adoption support.
Executives may need guidance on interpreting scorecards and trends. Managers may need instruction on filtering reports, identifying exceptions, and investigating causes. Analysts may require deeper training in data modeling, calculation languages, visualization design, and report publishing. Administrators need knowledge of security, refresh management, workspace control, and platform monitoring.
Adoption improves when the system solves visible business problems. Early dashboards should replace difficult manual reports or provide information that was previously unavailable. Feedback sessions, usage monitoring, office hours, and updated documentation can help teams refine the solution. Strong adoption turns analytics from a project deliverable into an everyday management capability.
Measure Business Intelligence Performance and Return on Investment
Track the operational and financial impact of the consulting engagement. Business intelligence return on investment may come from reduced reporting time, faster decisions, lower software costs, improved forecast accuracy, fewer data errors, better inventory management, increased sales conversion, or stronger customer retention.
The measurement process should establish a baseline before implementation. If a monthly report currently requires forty hours of manual work, the organization can compare that effort after automation. If inventory decisions are based on week-old data, the company can measure the value of daily or hourly visibility. These comparisons make the results of the initiative easier to demonstrate.
Usage measures also provide valuable information. Report views, active users, refresh reliability, query performance, support requests, and adoption by department can show whether the system is delivering sustained value. Low usage may indicate that a dashboard is difficult to understand, does not answer a useful question, or has not been supported with adequate training.
Plan Ongoing Optimization and Support
Maintain the business intelligence environment through regular review, technical support, and planned improvements. Data sources change, business priorities evolve, and users request new measurements. Without ongoing management, dashboards can become outdated and data pipelines can fail silently.
Support services may include platform administration, report maintenance, performance tuning, data pipeline monitoring, security reviews, and user assistance. Consultants can also help internal teams manage releases, test changes, document updates, and prioritize enhancement requests. These services protect the initial investment and reduce operational disruption.
Optimization should follow a predictable cycle. Teams can review usage, collect feedback, remove duplicate reports, improve slow dashboards, and add new data sources according to business value. This approach keeps the analytics environment aligned with changing needs while preventing uncontrolled growth.
Choose a Qualified Business Intelligence Consulting Partner
Select a consulting partner with the technical skills, industry understanding, and communication ability required for the project. Relevant experience should include data integration, architecture, analytics platforms, visualization, governance, training, and implementation management. The partner should be able to explain technical decisions in clear business language.
Review case studies, project methods, platform certifications, support models, and references. Ask how the consulting team handles data quality problems, changing requirements, security, user adoption, and knowledge transfer. A capable partner should provide a practical delivery plan and identify risks before implementation begins.
The relationship should also support internal capability development. Consultants should document the solution, train employees, and avoid creating unnecessary dependency. The strongest engagement leaves the organization with both a working business intelligence system and the knowledge required to manage and expand it.
Define a Clear Business Intelligence Consulting Roadmap
Organize the engagement into manageable phases with defined outcomes. A typical roadmap begins with discovery and assessment, followed by strategy, architecture, data integration, modeling, dashboard development, testing, training, and deployment. Ongoing support and optimization continue after the initial launch.
Each phase should include deliverables, owners, deadlines, dependencies, and acceptance criteria. For example, the discovery phase may produce a data source inventory and prioritized use case list. The architecture phase may deliver a warehouse design and integration plan. The dashboard phase may produce executive, financial, and operational reports based on approved measures.
A phased roadmap allows the organization to deliver value early while maintaining long-term direction. It also gives stakeholders regular opportunities to review progress and adjust priorities. Clear planning reduces implementation risk and helps technical work remain connected to measurable business outcomes.
Conclusion
Business intelligence consulting gives organizations a structured way to transform operational data into useful information for planning, monitoring, and decision-making. The work includes far more than installing a dashboard tool. It requires clear business priorities, reliable data sources, scalable architecture, consistent measurements, secure access, user training, and ongoing support.
A successful engagement produces trusted reporting, reduces manual effort, improves visibility, and enables departments to act on accurate information. It also creates a foundation for forecasting, automation, self-service analytics, and advanced analysis. By selecting the right consulting partner and following a phased implementation roadmap, an organization can build a business intelligence environment that supports both immediate needs and long-term growth.
FAQ’s
The cost depends on project scope, data complexity, platform choice, user count, integration requirements, and support needs. A focused dashboard project may require a limited engagement, while an enterprise implementation involving multiple systems, departments, and governance controls requires a larger investment.
A small reporting implementation may take several weeks, while a company-wide analytics program may take several months or longer. Phased delivery allows organizations to launch high-priority dashboards before the entire environment is complete.
Companies benefit from consulting when reports are slow, data is inconsistent, teams depend heavily on spreadsheets, or leaders lack reliable performance visibility. Consulting is also useful during cloud migration, platform replacement, mergers, rapid growth, or analytics modernization.
Consultants commonly work with Microsoft Power BI, Tableau, Qlik Sense, Looker, Snowflake, Microsoft Fabric, Azure, AWS, Google Cloud, Databricks, SQL databases, integration platforms, and data quality tools. The recommended combination depends on the organization’s requirements and existing systems.
Yes. Better reporting can reveal pricing problems, unnecessary costs, low-performing products, inefficient processes, sales opportunities, inventory risks, and customer retention issues. The financial impact depends on how quickly the organization acts on the insights.
Yes. Consultants can review current dashboards, data models, pipelines, security controls, platform costs, and user adoption. They can then improve performance, standardize calculations, remove duplicate reports, strengthen governance, and redesign the system for future growth.


